


(WSIL) -- The State of Illinois saw some highs and lows in the annual Report Card by the State Board of Education.��
Illinois has 852 total districts throughout the state, which includes 3,841 schools. Of the schools in the state:
- 372 exemplary
- Highest-performing 10 percent of schools
- 2,831 commendable
- All other schools that are not Exemplary, Comprehensive, or Targeted
- 318 targeted
- Would be Commendable or Exemplary based on overall performance, but has one or more student groups on par with the lowest-performing 5 percent of schools
- 197 comprehensive
- Lowest-performing 5 percent of schools
Click each county to find your local district's report card.
| �� | �� | |
| �� | ||
| �� | �� | �� |
| �� | �� | �� |
| �� | �� |
Here are some of the findings in this year's report:
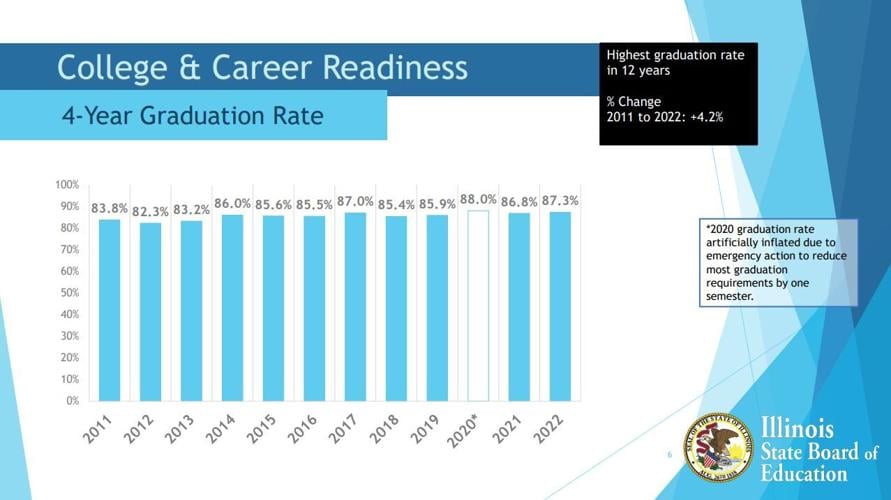
Graduation Rate
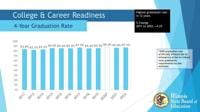
Illinois notched its highest graduation rate in a decade at 87 percent. That is for students who entered 9th grade in 2018 and graduated in 4 years.��

The graduation rate is 0.5% higher than 2021 and more than 4% higher than 10 years ago.
When looking at demographics, white students had a graduation rate of over 90%. That is different for other races with black students graduated at 79.5%, Hispanics coming in at 85%, Asians seeing 94.8%, Native Americans graduating at a rate of 80% and Pacific Islanders seeing 86.3% graduate/��

Illinois Assessment of Readiness
When looking at the Illinois Assessment of Readiness, the percentage of students prepared for the next level of learning, there are some variations.��
- English Language Arts
- 23.1% Did not meet performance levels
- 21% Partially met
- 25.8% Approaches
- 26% Met
- 4.1% Exceeded
- Math
- 22.1% Did not meet performance levels
- 27.4% Partially met
- 25% Approaches
- 21.6% Met
- 3.9% Exceeded
When looking at the data compared to 2021, students improved their readiness for the next level in 2022 by a couple percentage points.��
State Environment
Nearly 85% of students entering Kindergarten are educationally ready for the next step.��
The average classroom size across the state is 20 students, which is on par with the last several years.��
When looking at district finances, 48% of expenditures are on instruction, 2% on general administration, 29% on support services and 20% on miscellaneous expenses.
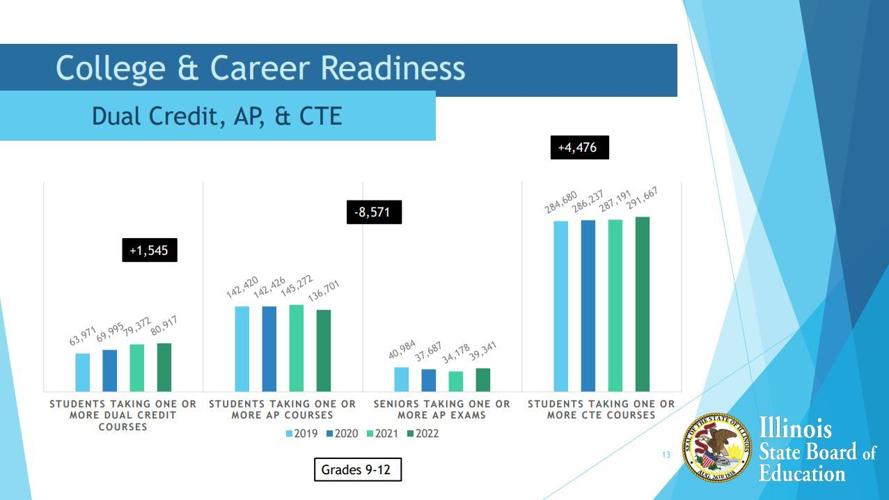
College and Career Readiness
Different types of classes can prepare students for the next stages after high school.��

Students taking one of more dual credit courses jumped by 1,000 with 80,917 enrolled.��
More than 136,000 students enrolled in one of more AP courses and more than 39,000 took one or more AP exams.��
Now when looking at��Career and Technical Education (CTE) courses, more than 291,000 students were enrolled. That is a more than 4 thousand student enrollment jump.��
National Assessment of Educational Progress
Illinois students scored above the national average in both reading and math for both grade 4 and grade 8.
| �� | IL- 2019 Average | ��IL- 2022 Average | National- 2019 Average�� | National- 2022 Average�� |
| Grade 4 Reading�� | 218�� | 218�� | 219�� | 216�� |
Grade 4 Math | 237�� | 237�� | 240�� | 235�� |
| Grade 8 Reading�� | 265 | 262 | 262 | 259�� |
| Grade 8 Math�� | 283 | 275 | 281�� | 273�� |
Enrollment, Absenteeism, Drop Out Rates, Homelessness, Low-Income
Illinois enrollment has stabilized post-pandemic time, but is still trending downward.��
- 2022: 1.896 million
- 2021: 1.887 million
- 2020: 1.957 million
- 2019:��1.984 million
- 2018:��2.001 million
- 2017: 2.028 million
- 2016: 2.041 million
- 2015: 2.054 million
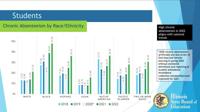
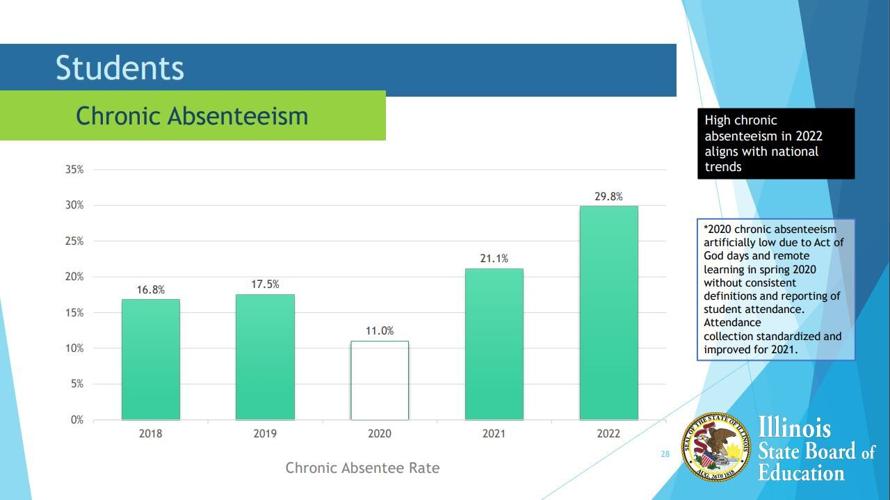
Absenteeism is still a growing problem among Illinois students. Chronic absenteeism is missing 10% or more of school days per year, with or without a valid excuse.

When looking at race, the absenteeism varies differently for your cultural background.��

Drop out rates remained very low for all demographics, with 3.3% of all students dropping out of school.
When looking at the home life for these students, 2% of enrolled students in the State of Illinois are homeless.��
Low-income households are still at a high rate statewide. 46.5% of students are low-income, which is a 2% drop from the previous school year.��
Teachers
Illinois has a total of 134,000 teachers, with 59% holding a master's degree or higher. The average salary for teachers statewide now sits at more than $72,000.
The ratio of students to teachers is 17:1 and the retention rate for all teachers if 88%. According to the Report Card, 97% of teachers are proficient or excellent at their jobs. And 66% of teachers hold fewer than 10 absences in a school year.��
Administrators
When looking at administrators, there is an average of 147 students per every administrators. Their average salary is $116,000.
Demographics aren't as diverse in administration.��
- White: 76%
- Black: 14%
- Hispanic: 7%
- Asian: 1%
- Pacific Islander: 0.1%
- Two or more races: 0.8%
To learn more about this year's Report Card and see all the data .��